Blog
Debugging a dynamic reporting engine at billion-row scale with distributed tracing
By Eric Loflin

As an Engineering Manager at Koddi, I get the opportunity to build advertising technology that powers commerce media for some of the world’s largest brands. Our reporting service is critical infrastructure: it’s how customers understand the performance of their ad spend. At scale, that means queries examining billions of rows of advertising performance data. Customers expect real-time insights, but no two reporting requests are the same. We handle a wide variety of report types, custom configurations, and customer-specific schemas. That dynamic nature makes it even more important to understand exactly what’s happening inside the service.
Debugging production issues used to involve sifting through logs across multiple services, trying to piece together what happened. A slow report? Good luck figuring out if it was a database query, a validation step, or something in between. We could have simplified this by standardizing reporting into a one-size-fits-all solution, but that’s not what sophisticated advertisers need. The flexibility that makes our platform valuable is also what makes observability challenging.
We recently completed work to add full APM (Application Performance Monitoring) distributed tracing to our reporting service, and the difference is night and day. This post walks through what we built, why it matters, and how we approached the implementation.
What is APM distributed tracing?
APM lets you trace a single request as it flows through your services, showing exactly where time is spent and where errors occur. Instead of correlating timestamps across log files, you get a visual timeline of everything that happened—HTTP calls, database queries, business logic—all connected in a single view.
Distributed tracing takes this further by connecting spans across service boundaries. When our API gateway makes a request to the reporting service, we see the entire journey as one trace, not two disconnected events.
If you’re new to distributed tracing, Datadog’s APM documentation is a great starting point.
What we built
Our implementation spans three repositories, each playing a specific role:
- Shared framework: We added a tracing package with reusable utilities that any service can import. This includes safe span creation with panic recovery, conditional tracing based on sampling rates, and helper functions for adding standardized tags across database, HTTP, and business logic operations.
- Reporting service: We now trace the complete report generation lifecycle, from HTTP handler entry through configuration loading, validation, query building, database operations, and response processing.
- API gateway: We added parent span creation before outbound HTTP calls and automatic trace header injection, enabling end-to-end traces across service boundaries.
Sampling strategy
One thing we learned quickly: you can’t trace everything at 100% in a high-volume system. We defined a sampling strategy that balances visibility with overhead:
| Rate | Use case |
|---|---|
| 100% | Critical paths, errors |
| 50% | Business operations |
| 10% | Database queries, API calls |
| 1% | Frequent operations |
| 0.1% | Very high-frequency operations |
This gives us full visibility into errors and critical paths while keeping trace volume manageable for high-frequency operations.
Key design decisions
A few choices we made that might be useful if you’re implementing something similar:
- Manual SQL tracing over automatic instrumentation. We removed automatic SQL tracing to prevent duplicate spans and enable full query visibility in span metadata. This gives us more control and cleaner traces.
- Nil-safe span handling. All our tracing functions gracefully handle nil spans when tracing is disabled. This means you don’t need nil checks scattered throughout your code; tracing just becomes a no-op when it’s off.
- Panic recovery in span creation. We wrap tracer calls with panic recovery so tracing issues never crash the service. Observability should never take down production.
- Configuration-driven enablement. Each component can enable or disable tracing independently via configuration. This made rollout much safer because we could enable tracing incrementally and disable it quickly if we saw issues.
- Context propagation everywhere. We updated our factory interfaces to require context.Context for proper trace hierarchy. This was probably the most invasive change, but it’s essential for traces that actually make sense.
Implementation pattern
Here’s the general pattern we followed for adding spans:
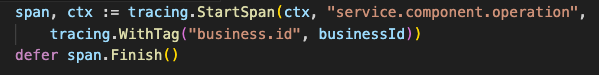
For high-frequency operations, we use conditional tracing:
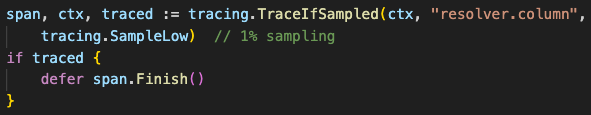
We settled on the naming convention service.component.operation for span names—things like reporting.query.execute or reporting.resolver.column. Consistent naming makes traces much easier to navigate and query.
The results
This work has fundamentally changed how we debug issues. What used to take 30 minutes of log correlation now takes 30 seconds of clicking through a trace.
More importantly, we can now be proactive. We’re building monitors and SLOs based on trace data to detect latency spikes and error rate increases before customers notice. When we need to optimize performance, we know exactly which database queries or business operations to target—no more guessing.
What we’d do differently
If we were starting over:
- Add context propagation earlier. Retrofitting context.Context through existing code was the most time-consuming part. If you’re building a new service, bake this in from day one.
- Start with a single service. Early on, we tried to implement across multiple services simultaneously. It would have been faster to get one service fully instrumented, prove the value, then expand.
- Define sampling strategy upfront. We initially traced too much, then had to dial it back. Think about your volume and cardinality early.
Wrapping up
Distributed tracing isn’t new or exotic; it’s table stakes for operating modern services. But “table stakes” doesn’t mean it’s easy or obvious to implement well. Hopefully, our experience is helpful if you’re on a similar journey.
If you’re working on something similar, I’d love to hear how you approached it. You can find me on LinkedIn.
Interested in working on problems like this? We’re hiring.
GET IN TOUCH
Ready to get started?
Don’t let your brand get lost in the noise. Partner with Koddi to unlock the power of commerce media and transform the way you engage with your customers. Our team of experts is here to help you navigate complexities and develop a strategy that drives results — no matter what industry – in as little as 45 days.